Mean Median Mode Guide: Basic Statistics Examples
This guide is about the three most common “one number summaries” for a list of data: mean, median, and mode. The title matters: they are not interchangeable. The mean answers a question about total and count. The median answers a question about position in an ordered list. The mode answers a question about repetition. If you pick the wrong summary, you can describe the same scores in a way that sounds true but misleads a reader, which is why homework and articles often ask you to report more than one measure.
A second goal here is practical fluency with small classroom data sets: short grade lists, quiz scores, simple survey answers, and counts. You should be able to compute each measure by hand when needed, and use a calculator page to check your work when the list is longer or the numbers are messy.
Why you need more than one summary number
Real data can be symmetric and “nice,” or it can have outliers, repeat values, and gaps. A single outlier can pull the mean a lot but barely move the median. A list with a dominant repeated score can have a very clear mode even when mean and median tell different stories. Teachers often want you to compare mean and median to talk about skew, and to use mode when the question is about the most common category, not a precise average of everything.
If you are summarizing for yourself while studying, think about what you want the summary to do. If you want a fair “balance point” and every number matters equally, you want the mean. If you want a typical middle value and you do not want a single far-away value to dominate, the median is often more stable. If you want to know what value happens most, you want the mode (when it exists and is useful).
Mean: arithmetic average
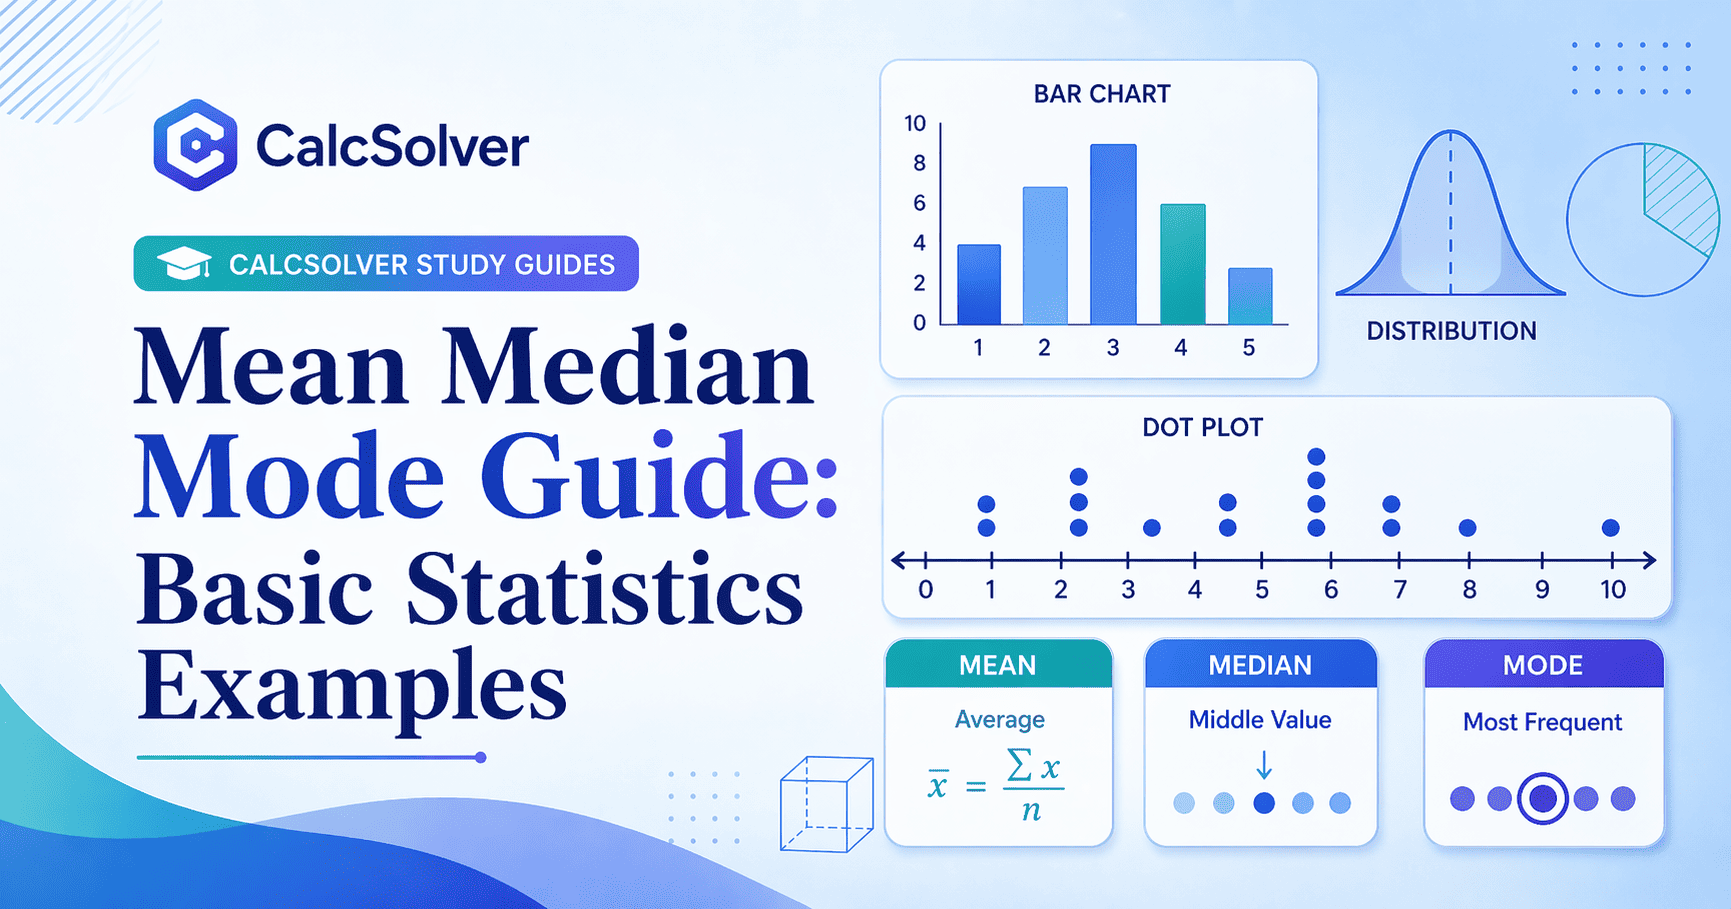
The mean is the sum of all values divided by how many values you have. In symbols, for values x1 through xn, the mean is (x1 + ... + xn) / n. The mean is sensitive to every value. That is a strength for some purposes and a weakness when one extreme score is not “typical” of the group.
When the data are grades or test scores, the mean is often the number people mean when they say “average,” but you should still be explicit. If a rubric or policy focuses on a median cutoff instead, a student who only tracks the mean can misunderstand their standing in the class or on a distribution.
Median: the middle of the ordered list
To find the median, sort the values from smallest to largest. If the count is odd, the median is the single middle value. If the count is even, the median is the average of the two middle values. The median is not a “type of mean,” it is a position-based summary: half of the data are at or below it and half are at or above it, in the sense used in introductory settings with simple lists.
Median is especially easy to explain with scores where one person is very low or very high, because the median is less tempted to chase that outlier. For example, in small project groups, a single missing assignment can depress a mean in a way that a median sometimes reflects more gently, depending on the full list. Always keep n small enough that you can see the data you are talking about, instead of only trusting a single summary line.
Mode: the most common value
The mode is the value that appears most often. A data set can have no mode if no value repeats, one mode, or more than one mode if two values share the top frequency. Modes are natural for categorical or rounded scores and for “most common size” type questions, but a mode is not always near the mean or median. If most students earn the same score, the mode tells you that cluster exists even if a few other scores are spread out.
Range: quick spread, used with care
Range is often defined as the maximum value minus the minimum value. It is a simple “spread” measure for small lists, but it can be overly influenced by a single outlier, similar to the mean. This guide mentions range because you may be asked to report it alongside mean, median, and mode in a first statistics unit. Treat it as a quick scan, not a full description of consistency.
Worked data set: one list, three summaries
Take the test scores: 84, 90, 90, 72, 88, 95, 90. The list has seven values, so the mean is the total sum divided by 7. The mode is 90, because 90 appears three times, more than any other score. To find the median, sort: 72, 84, 88, 90, 90, 90, 95. The middle of seven numbers is the fourth value, so the median is 90. In this particular list, the median and the mode are both 90, while the mean is pulled slightly by the 72, which is a good example of mean being lower than the cluster when a single score is much smaller than the rest.
Another short example: 10, 10, 12, 18. The mean is 12.5, the median is 11 (average of 10 and 12), and the mode is 10. The mean and median differ because the 18 pulls the mean up more than the median, which is the kind of story teachers want you to be able to tell in a sentence, not just a calculation.
When a simple average is misleading
Mean, median, and mode can all be “right” as calculations and still be wrong for the story you want to tell. A classic classroom example is income or prices in a data set with one very large outlier, where the mean is far above what most people experience, while the median is closer to a typical value. A second issue is mixing scales: you cannot add letter grades A and B as if they are numbers unless you have an agreed chart. For plain numeric scores, keep units consistent, and for surveys where answers are words, the mode is often the most honest single summary.
When a teacher or article asks for “which measure of center is best,” they usually want you to connect the shape of the data to the definition of the measure, not to compute three numbers and stop.
Common mistakes
Forgetting to sort for the median. The middle value in the original, unsorted list is not the median.
Counting even-sized medians wrong. With an even number of values, the median is the mean of the two middle sorted values, not one of the middle numbers chosen at random.
Assuming the mode is “in the middle.” The most frequent value can be the smallest or the largest in the data set, depending on repetition.
Letting a calculator do all thinking. You should still be able to explain in words which measure answers which question, especially on written exams.
Confusing data value with count. n is the number of entries, not the sum of the entries. The mean divides by n, and that denominator must match the number of values you actually included in the sum.
FAQ
Can a data set have more than one mode?
Yes. Bimodal data sets are common in real surveys when two answers are tied for the top frequency. Some classes also treat “no mode” or “all modes” under specific definitions; follow your course’s definition if it is given.
Is the mean always between the min and max?
For a simple list of real numbers, yes. The mean is a balance point, so it must lie in the range from the minimum to the maximum, unless the course uses weighted means with negative weights, which is outside basic mean–median–mode work.
What if there is a zero in the data?
Zero is a real value. It is included in the sum and in the count for the mean, and it appears in the sorted list for the median, just like any other number.
When should I use a calculator page?
Use a structured tool like the Mean Median Mode Calculator when the list is long, when you are checking homework, or when you need range and count in the same pass as the center measures. Doing one example by hand and then matching the tool helps you trust the output.
Related tools and next reading
Use the Mean Median Mode Calculator to summarize a full list in one pass. The GPA Calculator and Percent Calculator are useful when your “data set” is really grades, weights, and partial credit expressed as percent. If you want a longer story about when percent math matters for grades, read the percent and decimal guide to keep conversions and wording aligned with the statistics you are reporting.
Applied learning context
How this topic appears in real coursework
In real classes, this topic usually appears inside mixed assignments instead of in isolation. Students may need to combine definitions, formulas, and interpretation in a single response, which is why practicing only one template answer is often not enough. A stronger routine is to check what the question is really asking, identify the required variables, then map the setup to the correct method before calculating.
Common reasoning traps and how to prevent them
The most frequent mistakes happen before arithmetic starts: reading symbols too quickly, mixing units, applying the wrong formula, or skipping assumptions. To avoid this, write a short pre-check line for each problem: identify known values, unknown values, constraints, and expected answer size. This one-minute habit prevents many avoidable errors and improves final answer quality more than repeated button pressing.
How to self-verify before submitting answers
After solving, verify by estimation and by method. Estimation checks whether the result is in a plausible range. Method checks whether each step still matches the original question intent. If either check fails, revise the setup first instead of retyping numbers. This approach builds transferable problem-solving skill, not just short-term answer accuracy.